Axial Modal Behavior of Rooms De-mystified
With 6 diagrams
Michael Blackmer, Acoustician
1-29-07
I have seen many problems in music rooms that are the clear result of axial behavior. While higher order oblique and tangential modes certainly exist I have rarely seen listening position problems that could be directly attributed to them. For this reason I tend to concentrate on axial distribution when proportioning rooms for sound or troubleshooting an existing room.
While it might logically seem that the lowest resonance between a pair of parallel surfaces might be the one whose full wave fits between them, as in the case of a guitar string, it is actually a wave twice this long. One way to think of this is as the room talking to its own delayed images. Each axis (length, width and height) resonates as though there were a pattern of integral numbers of full cycles in a space twice as long as the distance between the parallel surfaces. This translates to the actual room being divided into integral numbers of half cycles at the resonances, with the patterns of the surrounding delayed virtual rooms folded in on, superimposed on and producing interference patterns with the half cycles in the real room. You can think of this as the electro-acoustic map being folded. Each ascending higher order mode adds another set of folds.
The number of half cycles between the surfaces is referred to as the mode number. The ascending modes form a simple harmonic series of whole number multiples of the lowest resonance, F1. For example between a surface pair 28.25 feet apart F1 is 40Hz, F2 is 80Hz, F3 is 120, F4 is 160 and F5 is 200 and so on up by every 40Hz. These are: the octave, the fifth above that, the super-octave, then above the super-octave, the major third, the minor third, the full step, the half step, then the intervals become smaller than a half step and nonmusical, exactly as in the case of chiming the harmonics on the E string of a bass tuned a tiny bit flat. At these frequencies the surface pair stores sound energy reactively and releases it over time.
In the case where an untreated shoebox room is being driven directly from one of the surfaces, as when a speaker is mounted into a wall, odd-numbered modes (1, 3, 5, 7…) produce a null at half the room dimension from the speaker and even numbered modes (2, 4, 6, 8…) produce a peak. As the drive point is moved into the room the pattern of peaks and nulls shifts with it, maintaining the same spacing. (There are also first reflection delay effects that produce ripples, not considered here.) The rather messy frequency response ripple at room center (fig 3c), can be cleaned up to some degree by shifting the drive point.
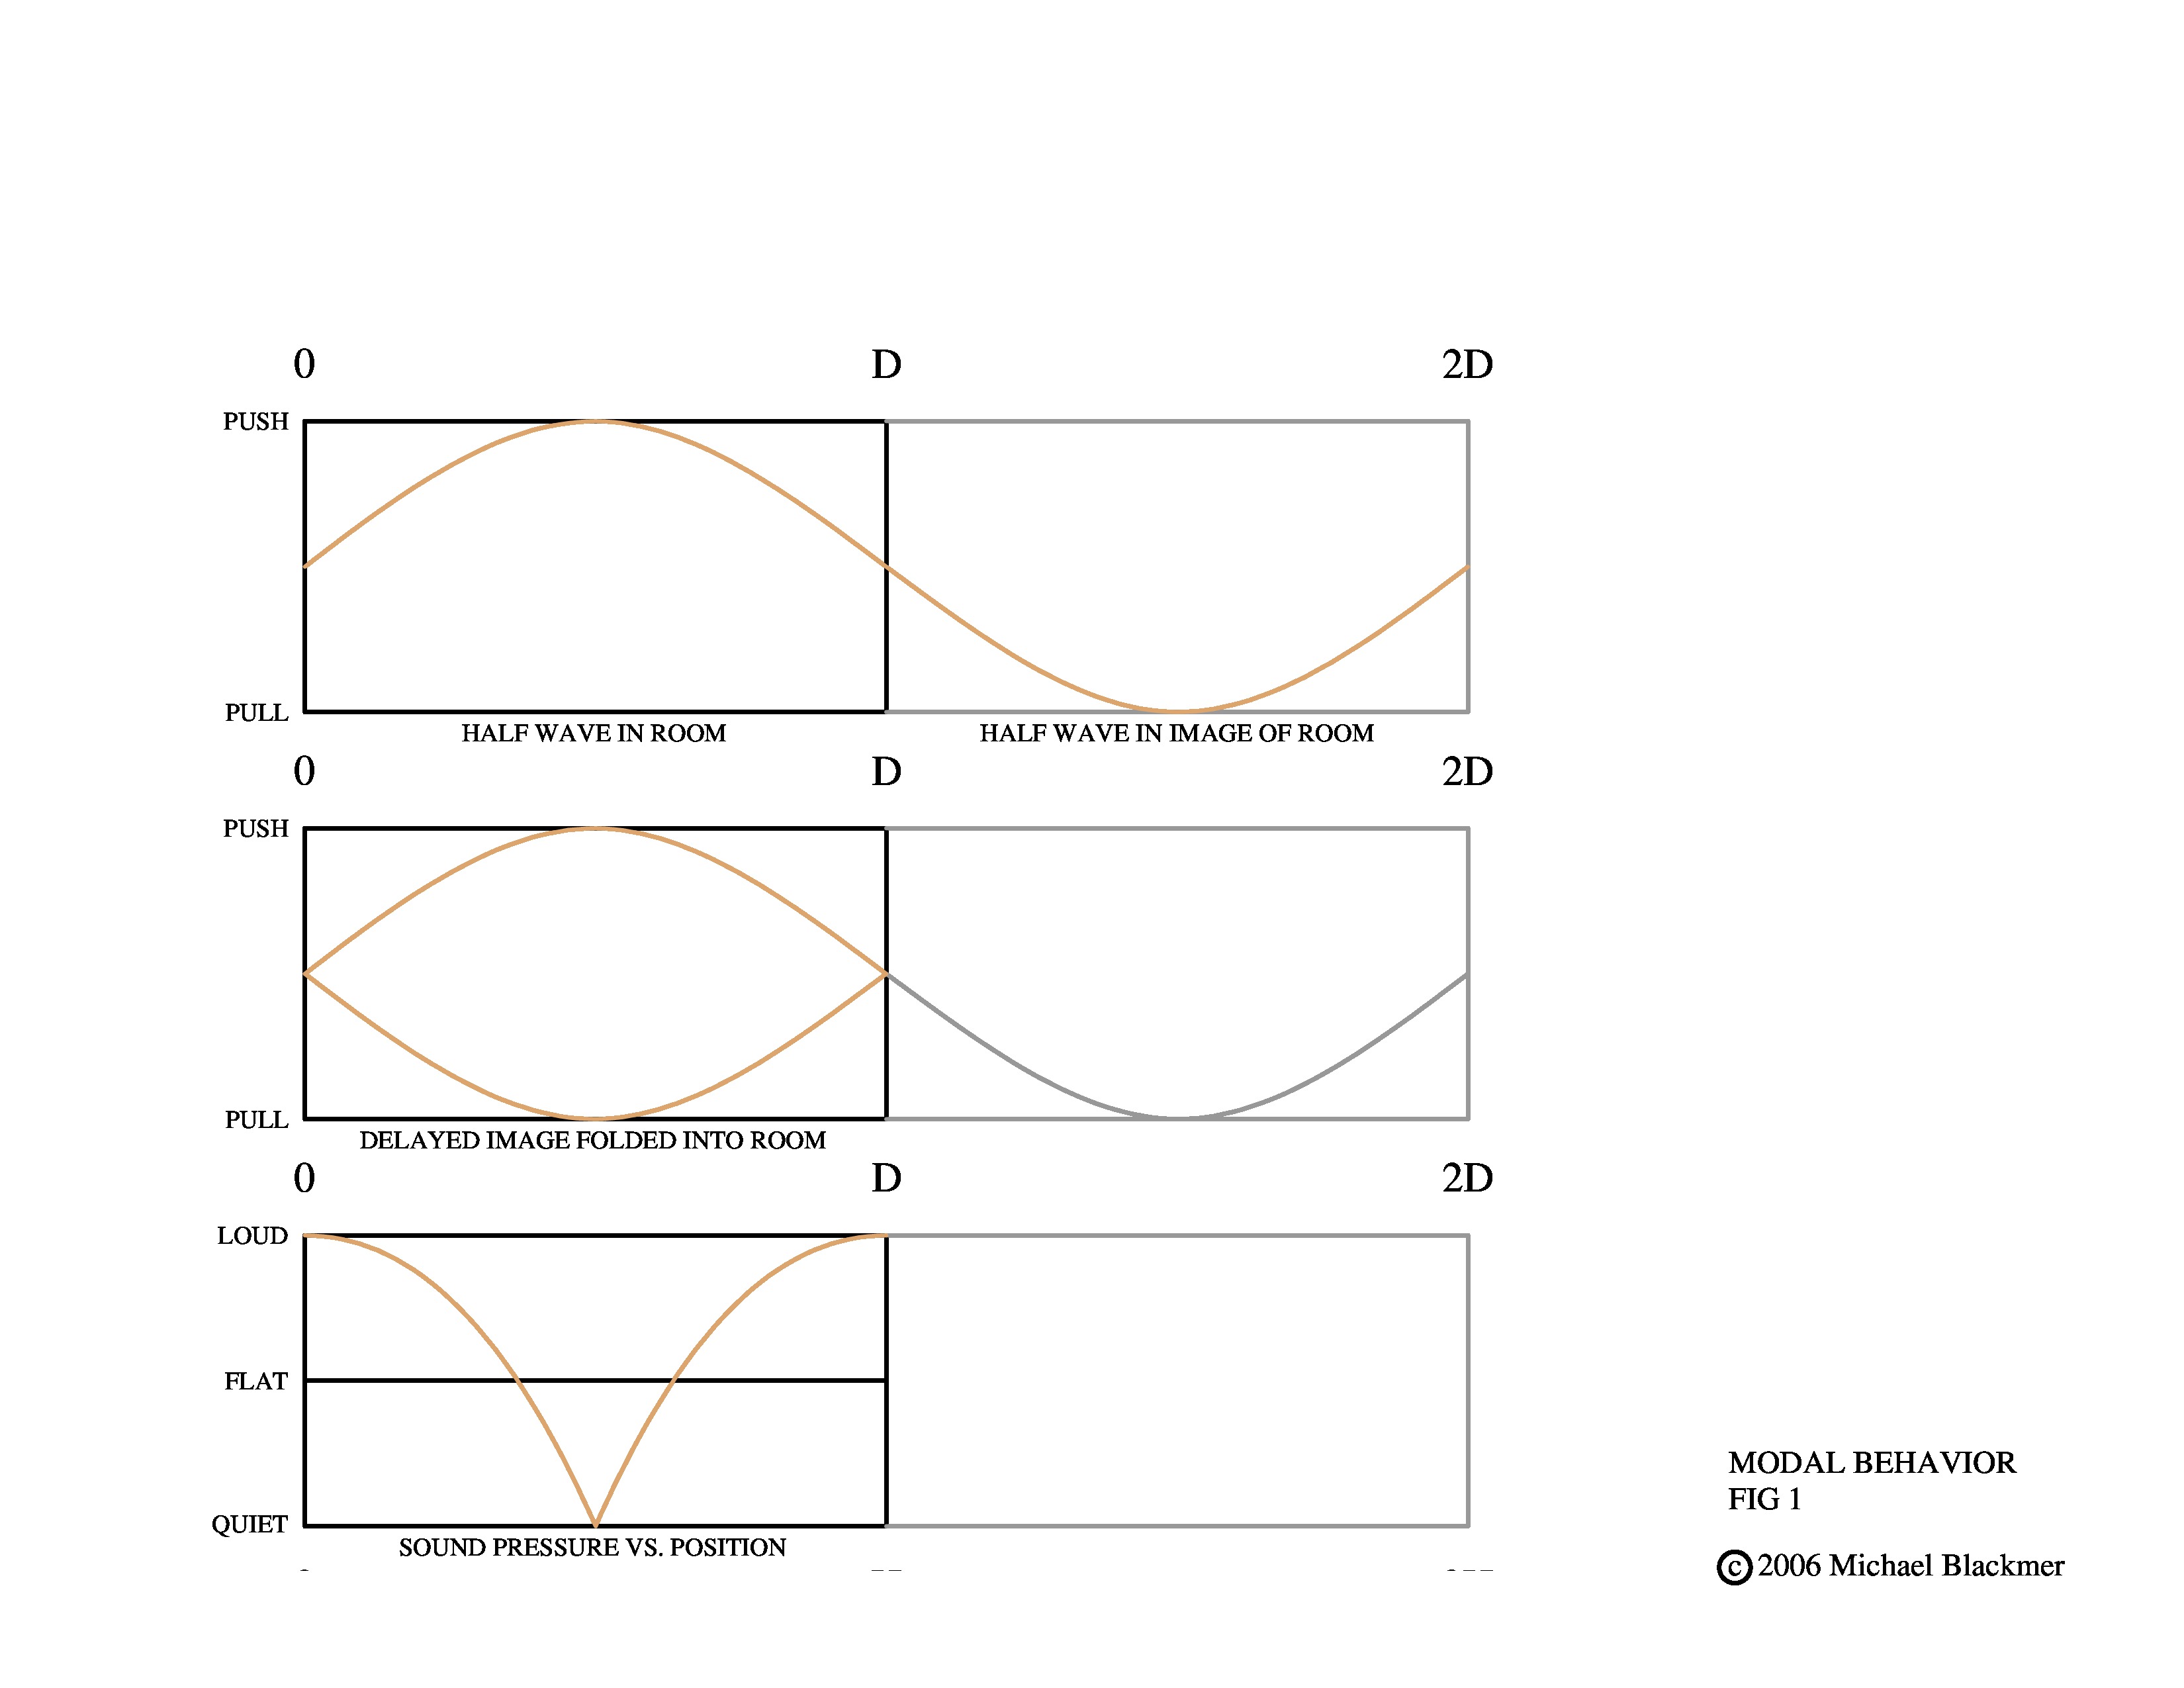
Fig 1 illustrates the most basic case of mode F1 between two surfaces and the resulting interference pattern. We can see, because the pressure and rarefaction (push and pull) half-cycles are superimposed and so are 180 degrees out of phase, that there is a sound pressure null in the center and a peak at each surface. It is not that the sound is gone in the center of the room; indeed the energy of many reflected cycles is still very much present there, but the part that appears dipped out at that point in space is in potential rather than kinetic form and so cannot do useful work, such as moving an eardrum or microphone diaphragm. The sound is effectively hiding parts of itself. This is purely the result of reflected energy. If it were possible to make the opposite surface completely absorbent the pattern of peaks and nulls would go away. When the walls are made partially absorbent or geometrically complex on a large scale, the resulting nulls will be broader and less deep and the peaks broader and less tall. This is to say that the Q of the resonances is reduced by the addition of a resistive component (that converts sound to heat, just as in the case of resistive damping of an electrical LC resonance) or by geometrically walking energy out of axial into more complex modes.
Until things get so loud that they make the air non-linear, as in the case of shock waves where the speed of sound is being strongly modulated by the heat of the wave-front raising its local velocity (and let’s sincerely hope that we never witness this effect close up, not even for a moment!) sound waves are virtually transparent to each other and obey the rules of vector summation. Simply put, at the location of deep nulls as they pass through each other the overlaid anti-phase half waves are moving the air molecules together and apart by the same distance, which of course adds up to holding still. This is a good example of an electro acoustic map being folded in such a way that you cannot access the information in the folds.
With a little thought it can be clearly seen that this class of room effect cannot be corrected with an equalizer, graphic or otherwise, though this doesn’t stop people from trying. These are time domain effects can only be effectively treated by removing energy from, or redirecting, the reflected field.
If deep nulls are equalized to appear flat on a Real Time Analyzer several undesirable things happen: the speakers and amps are asked to deliver much more energy at the boosted null frequencies, often on the order of 20dB, which they usually can’t, so; the headroom is reduced by the same amount at these frequencies, the audible distortion is increased (not linearly but in a harmonic power series) and the frequency response of both the direct and reflected sound fields is colored and corrupted by the attempt to make their sum appear flat. The worst problem is that a sound system over-equalized to look perfectly flat on a wide time window RTA will not actually sound flat. This is probably because we, as beings, have a complex array of multiple time integration windows of differing widths and offsets running in parallel and so we to some degree are able to sense the direct and reflected arrivals separately, as well as their sum. You need to be very careful with “room equalizers”. As David Blackmer used to say: “You should never go more than half way”.
-Fig 2 shows mode F2. Notice that, since this is an even numbered mode, there is a peak at room center.

-Fig 3 shows mode F3. Since this is an odd numbered mode there is a dip at room center.

-Fig 4 shows mode F4. Since this is an even numbered mode, there is a peak at room center.

-Fig 5 shows mode F5. Since this is an odd numbered mode, there is a dip at room center.

-Fig 6 shows modes F1 to F5 overlaid. The pattern continues up through higher orders.
A few words of explanation about the diagrams: In the top graph of each figure think of the sine wave shape as a light on the rim of a spinning and moving wheel seen vertically edge-on. The wheel is rotating at a constant rate, so that it makes a whole number of turns (1,2,3,4…) as it crosses the distance representing twice the room dimension from left to right at a constant velocity; 1130 feet per second in the case of sound through room temperature air. The spinning light draws a true sine wave shape. Picture the wheel bouncing off of the right hand surface (in the middle of the diagram) and making the return trip. You are now thinking about the phase of a rotating vector reflecting back into the room with a delay. Of course there is not actually a wheel or sine wave in the room, just the air molecules moving toward and away from each other in a subtle and chaotic dance of almost random thermal collisions (at that same average speed of 1130 ft per second!) that add up to wave behavior, yet in the simple form of this model you may picture the energy flow process.
In the middle graph the right hand (reflected) half of the wave train has been folded back into the real room. Here we must think in terms of vector addition because we are dealing with signal time delays. This means that the parts of the two curves that are nearer to each other are more nearly in phase and so add, while the parts that are farther apart are more out of phase and so subtract.
The bottom graph is the vector summation of the middle graph’s direct plus reflected waves, showing sound pressure vs. location. Where the reflected wave reaches the sound source again the wheel has made a full revolution and the previous cycle is delayed a whole number of 360 degree turns, (1,2,3…) which is very much like being in phase again. This interaction produces a loud spot there and at each place in the room where the phase curves are near or touching.
Resonance is just energy stored in multiple superimposed layers, taken over time, of this process of evenly spaced reflections passing back and forth between mirrors.